Application Profiler/CODE COVERAGE in Navision 2013 R2
In the previous versions of Navision we use to have code coverage which is used to trace C/AL Code and the developers used to have the ability to scan the piece of code which is executed during an action,process. This tool was very helpful in debugging. Even in Navision 2013 Microsoft shipped Application tool set which includes code coverage tool but in later version we don’t have this option.
In this blog I try to explain the options we have for Navision 2013 R2. The tool which is available for Navision 2013 R2 is **Application profiler** and which can be downloaded from the following link
[http://navappprofiler.codeplex.com/](http://navappprofiler.codeplex.com/)
The downloaded file has DLLs and few objects in .txt format. It also has readme file which will guide you through the easy install process. Rename the objects numbers if you already used them.
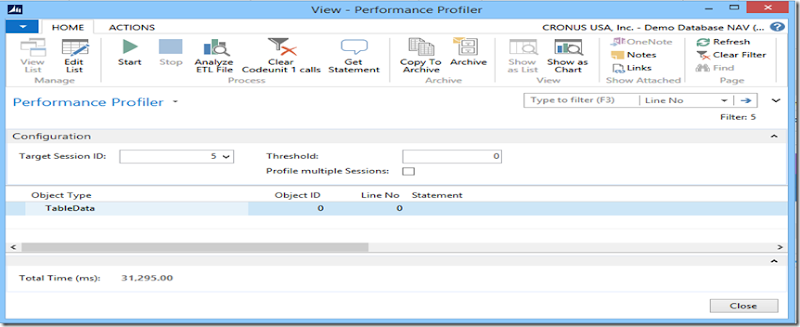
In order to run the code coverage run the Page 50000/ Performance Profiler
[ ](http://lh6.ggpht.com/-gJOVdrqCmxY/VOduHUMhhdI/AAAAAAAAIoA/-4mqol8ElEw/s1600-h/image5.png)
In order to trace the C/AL code for an action, please select the session you want to execute the trace for from the Target Session ID and click Start.
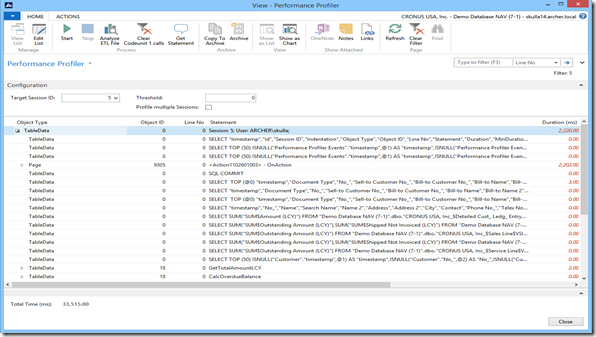
After executing the actions click stop. In the below example I executed the post action for the sales order.
The data it collects is combination of SQL Statements and C/AL code as shown in the below figure.
[ ](http://lh5.ggpht.com/-pu0SwZP4L9w/VOduRaH4pUI/AAAAAAAAIoQ/8Z2r4n-bLgY/s1600-h/image12.png)
In order to view only the C/AL code try to set the filter for the object ID <> 0 and you will see all the C/AL statements it executed for the action. You can view all the code and analyze it from the result set.
I have not tested this on 2015 but I believe it will work on it. When I get sometime I will test it on NAV2015 and post the results.
Please leave your questions and suggestions in the comment section.

Leave a comment